Tools / Project story
Bandwidth Topo
See terrain as contours and bands of elevation.
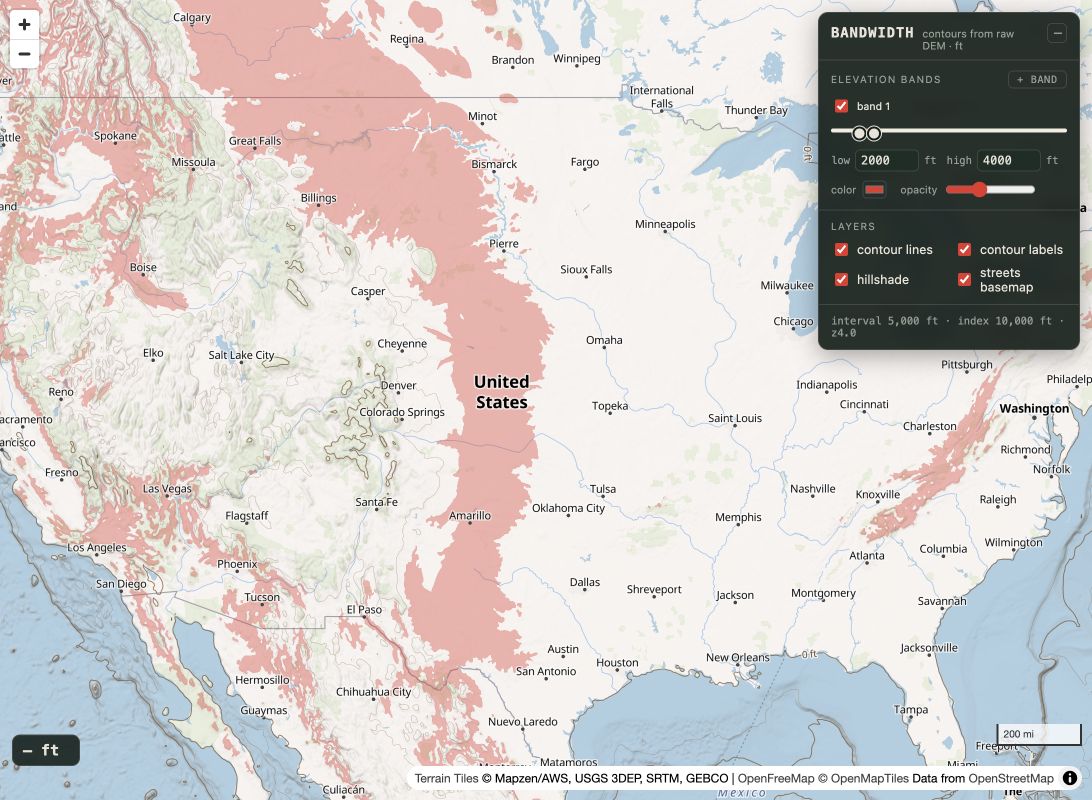
Two views of the same terrain
Bandwidth Topo is an interactive map for exploring elevation. Contour lines describe the shape of the ground, while colored bands highlight the areas between chosen lower and upper elevations. Pan and zoom to move through the landscape, then adjust a band to see where its range occurs.
The map supports up to three independent elevation bands. Each has numeric inputs, sliders, a color, and an opacity control. Separate layers can show neighboring or overlapping ranges. The same terrain can be read as a continuous set of contours or as a small number of areas selected by height.
Detail follows the view
Contour spacing changes with zoom. At a broad view, the interval is large enough to keep the map readable; close in, finer intervals reveal more of the terrain. Heavier index lines and labels provide reference points among the smaller lines. An interval readout makes the current spacing visible.
The contours are computed in the browser from elevation tiles rather than loaded as a finished line drawing. A worker decodes the terrain values and generates contour geometry. The colored bands use the same elevation source, connecting the two displays to a common set of measurements. Layer switches let the viewer compare contours, labels, and hillshade, and a minimal basemap removes the street-map context.
Reading the limits
More closely spaced lines do not create more accurate source data. The project documentation explicitly treats fine contour intervals as indicative, not survey-grade terrain. Interpolation can produce a smooth drawing between measured values, but it cannot add a measurement that was never captured. The prototype is useful for exploring patterns and relationships while keeping that distinction in view.
View position and layer settings can be shared in a URL, so a particular reading of the terrain can be revisited. The app uses MapLibre, maplibre-contour, AWS Open Data Terrain Tiles, and OpenFreeMap. Open the prototype to adjust a band, compare layers, and watch the contour interval change as you zoom.